Skip to main contentSkip to footer

XIRR vs CAGR vs Absolute Return: Which Number Should You Use for Your SIPs?

Open two apps and your SIP can show two different return numbers. Neither is necessarily wrong. They are usually answering different questions. Here is what absolute return, CAGR and XIRR each measure, and which one fits a SIP.

Short answer: Absolute return is a quick snapshot of total gain or loss. CAGR suits a lump sum held for more than a year. XIRR suits SIPs, because it accounts for the amount and date of every instalment.

What is absolute return?

Absolute return is the total percentage gain or loss between what you put in and what it is worth now: (current value − amount invested) ÷ amount invested. It ignores time completely, so 20% over six months and 20% over six years look identical. That makes it useful for a quick check on an isolated investment, but weak for comparing anything held for different lengths of time.

What is CAGR?

CAGR (compound annual growth rate) smooths growth into a single yearly rate: (ending value ÷ starting value) ^ (1 ÷ years) − 1. It works well for a lump sum, where one amount goes in on one date and comes out on another. Axis Mutual Fund’s explainer points out the catch for SIPs: CAGR assumes a fixed amount at the start and end of the period, which does not match how a SIP works.

What is XIRR?

XIRR (extended internal rate of return) takes every cash flow with its date, including each SIP instalment and any withdrawal, and finds the single annualised rate that results in today’s value of the portfolio. Spreadsheets have an XIRR function that takes a list of amounts and a list of dates. For a SIP, where each instalment stays invested for a different length of time, this is the closer fit.

A worked example with a SIP

These numbers are illustrative only and do not describe any real fund. Suppose a ₹5,000 SIP runs on the 1st of each month for 36 months, from 1 October 2023 to 1 September 2026. That is ₹1,80,000 invested. On 1 October 2026 the holding is worth ₹2,15,000.

MethodResultWhat it is really saying
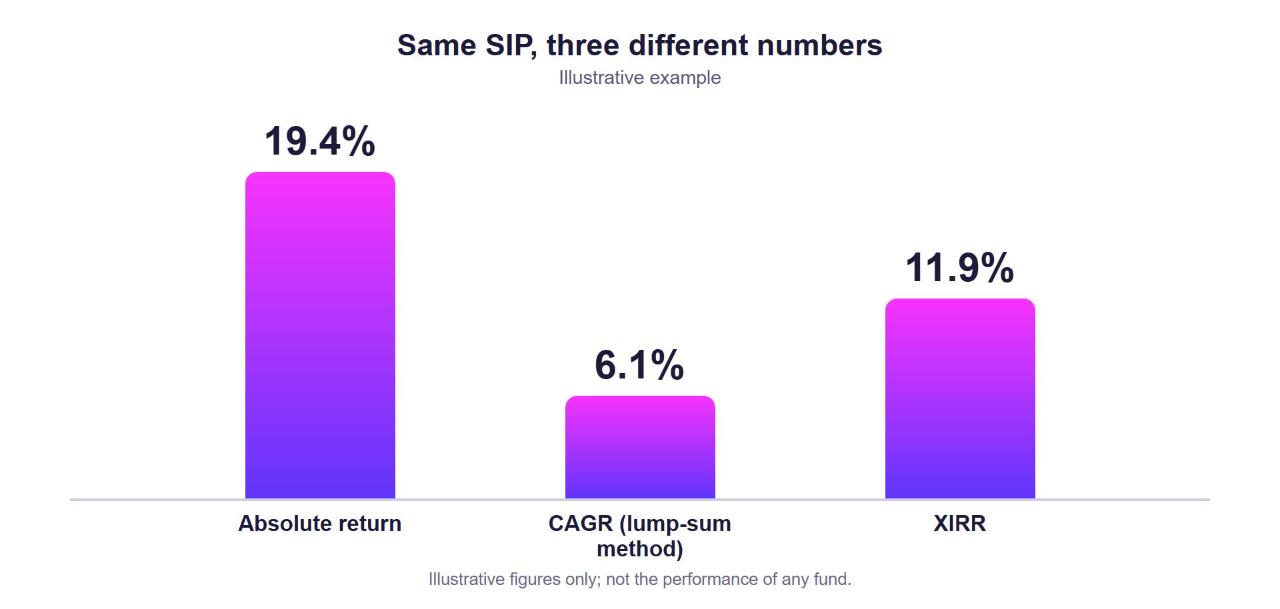
Absolute return≈19.4%Total gain on total money invested, ignoring time
CAGR, if you wrongly treat ₹1.8 lakh as invested on day one≈6.1%Understates it, because most of the money was invested for less than 3 years
XIRR≈11.9%Annualised rate that reflects when each instalment actually went in
Simple bar comparison of three return figures for the same illustrative SIP: absolute return, CAGR and XIRR

The three figures differ because they answer different questions. The first reports the total gain. The second pretends all the money was invested for the full three years. The third is the one that matches how a SIP actually behaves.

Why do two apps show different numbers for the same mutual fund?

There are a few common reasons. The valuation date may differ by a day or two. One app may show absolute return and the other XIRR. Dividend (IDCW) payouts, switches and redemptions may be treated differently. And XIRR over a short period can look extreme: for mutual funds with tenure of less than a year XIRR can give non-intuitive numbers, so absolute return is better there.

Which one should you use?

Which return measure is best for a SIP?

XIRR, once the SIP or investment has run for more than a year, because it accounts for the timing and size of each instalment.

Is CAGR wrong for a SIP?

It is not wrong, but it answers a different question. CAGR assumes one amount invested at the start. Use it for lump sums, or to compare two funds over the same period.

When is absolute return enough?

For a quick snapshot, or for any holding of less than a year.

Does a higher XIRR mean a better fund?

Not by itself. XIRR describes what has already happened over one specific period and says nothing about what comes next. Axis Mutual Fund’s guidance is not to rely on a single metric. Look at the fund’s objective, its risk and how it is allocated as well.

Putting it together for your family

If your SIPs sit across several apps, the real problem is often not the formula. It is that invested amounts and current values live in different places. Seeing them side by side is the first step to making sense of any return number. This is the kind of consolidated view Famli’s net worth dashboard offers, connecting your accounts via the RBI-regulated Account Aggregator framework. Whichever tool you use, check which measure it is showing and over which dates before comparing figures.


Investments are subject to market risks. Famli is a SEBI-registered Investment Adviser (INA000021979). Registration does not guarantee performance of advice or assurance of returns. Please read all scheme related documents carefully before investing.

Examples above are illustrative and do not represent the performance of any fund. Past performance does not indicate future results.