A worked example
Take a couple, both 35, who plan to retire at 60. Their household spends ₹60,000 a month today, which is ₹7.2 lakh a year. All figures here are illustrations built on stated assumptions.
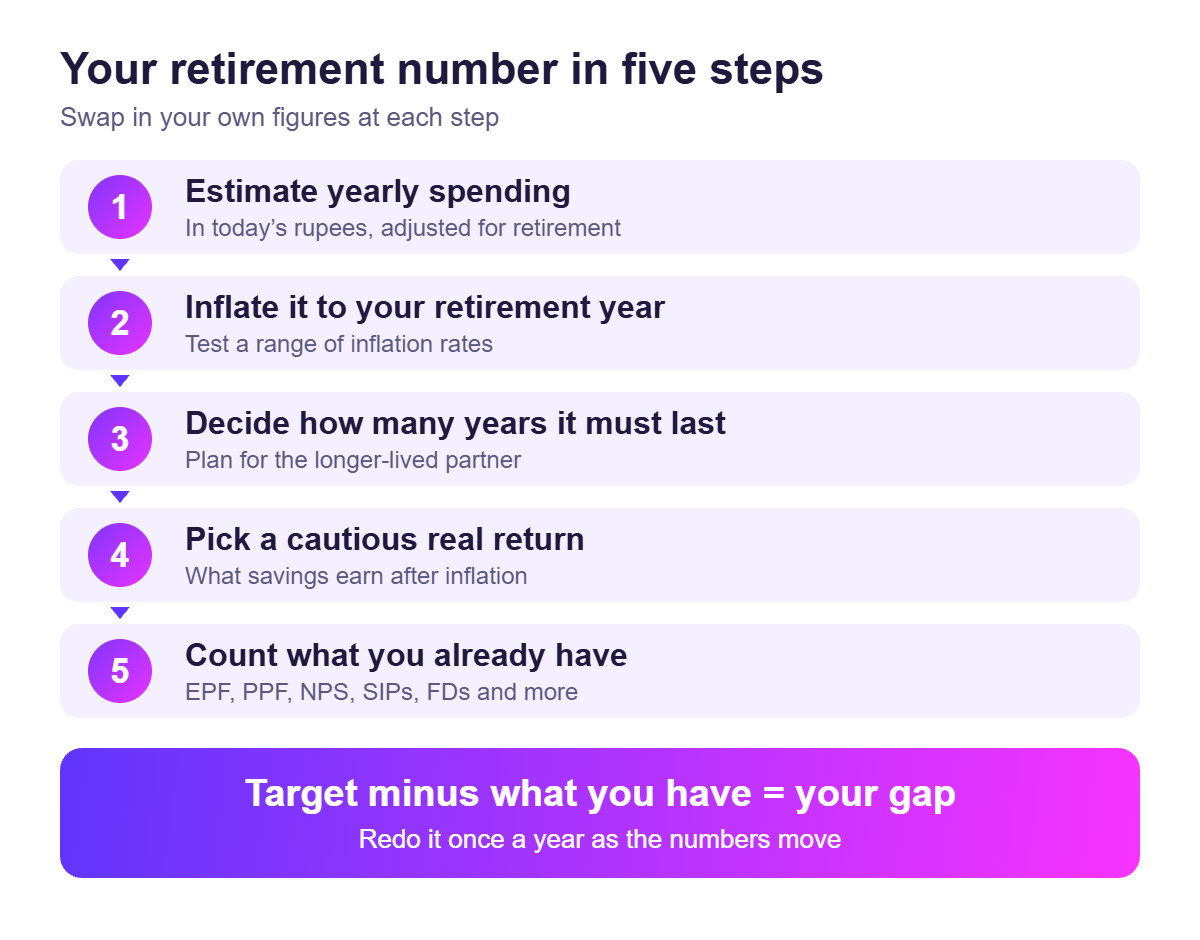
Step 1: Estimate what you will spend, not what you earn
Start with your current yearly spending, then adjust for retirement. A home loan EMI may be gone by then. Medical costs usually rise with age. Travel may go up. Write down one realistic number in today’s rupees. In our example it is ₹7.2 lakh a year.
Step 2: Inflate that number to the year you retire
Prices rise every year, so ₹7.2 lakh today will not buy the same things in 25 years. The Reserve Bank of India’s inflation target is 4 per cent, with a tolerance band of 2 to 6 per cent. Actual inflation over decades can differ from the target, so it helps to test a range.
| Assumed inflation (a year) | Yearly spend at 60 | Monthly spend at 60 |
|---|
| 4% | ₹19.2 lakh | ₹1.60 lakh |
| 5% | ₹24.4 lakh | ₹2.03 lakh |
| 6% | ₹30.9 lakh | ₹2.58 lakh |
The rest of this example uses 5 per cent, which gives about ₹24.4 lakh a year at age 60.
Step 3: Decide how many years the money must last
The Sample Registration System’s life tables for 2016 to 2020 put life expectancy at age 60 in India at 18.3 years on average: 17.5 for men and 19.2 for women. An average means about half of people live longer. A couple should plan for the longer-lived partner, so many people plan for 25 to 30 years.
Step 4: Choose a cautious assumption for earnings above inflation
Here we use “real return”, meaning what your savings earn after inflation is taken out. It is an assumption, not a forecast, and actual outcomes can be lower or higher. The table shows the savings needed at 60 for three planning periods, and how sensitive the answer is.
| Years to fund | 0% real | 1% real | 2% real | 3% real |
|---|
| 20 years | ₹4.88 cr | ₹4.44 cr | ₹4.07 cr | ₹3.74 cr |
| 25 years | ₹6.10 cr | ₹5.42 cr | ₹4.86 cr | ₹4.37 cr |
| 30 years | ₹7.31 cr | ₹6.36 cr | ₹5.57 cr | ₹4.92 cr |
Assumptions: ₹24.4 lakh of spending in the first year of retirement, rising 5 per cent a year, drawn at the start of each year. Taxes and one-time expenses are not included.
Read the table for the spread, not for one number. Moving from 20 to 30 years adds over ₹2 crore. Moving the real-return assumption from 3 per cent to 0 per cent adds about ₹2.4 crore at 30 years. Small changes in assumptions matter more than most people expect.
Step 5: Count what you already have, then see the gap
List what is already set aside for retirement: EPF, PPF, NPS, mutual fund SIPs, FDs, and any rental income. Remember that some of these have exit rules. For example, PFRDA amended the NPS exit rules in December 2025. Reports on the change say non-government subscribers can take up to 80 per cent of the corpus as a lump sum at normal exit, with at least 20 per cent going into an annuity. Check PFRDA’s current rules before you plan around it.
The gap is your target minus what you already have, adjusted for the years left. It is worth redoing once a year, because both the target and the totals move.
What this method cannot tell you
- How markets will behave in the years you save or draw down.
- How much tax you will pay on withdrawals and annuity income.
- Large one-time costs, such as a child’s wedding or a medical event.
- What happens if one partner lives much longer than the other.
That is why a range is more honest than one number. If you want a specific plan, a SEBI-registered investment adviser can help you build one.
How can you keep track of the gap?
The hard part is rarely the formula. It is knowing your current totals across SIPs, FDs, bank accounts and loans, which sit in different apps and statements. Famli brings these into one net worth view through the RBI-regulated Account Aggregator framework, so you can set a retirement goal and see where you stand against it.
Frequently asked questions
What inflation rate should I assume for retirement planning?
There is no single right answer. The RBI’s target is 4 per cent with a band of 2 to 6 per cent. Many people test two or three values in that range and look at how much the result changes.
Should I plan to age 85 or 90?
Average life expectancy at 60 is about 18 years, but averages hide long lives. Planning for 25 to 30 years is a cautious way to avoid running short. It is a planning choice, not a prediction.
Does my retirement number include EPF and NPS?
Your target is the full amount you need. EPF, NPS, PPF and other savings count towards it. The gap is what remains after you count them.
The numbers in this article are worked examples built on stated assumptions. They are not forecasts, and they are not a promise of any outcome. This article is for general information and is not personalised advice, tax advice or legal advice.
Investments are subject to market risks. Famli is a SEBI-registered Investment Adviser (INA000021979). Registration does not guarantee performance of advice or assurance of returns. Please read all scheme related documents carefully before investing.
Sources
Worked example figures are calculated by Famli from the assumptions stated in the article (annuity-due withdrawals, spending growing 5 per cent a year, savings growing at 5 per cent plus the stated real return).